


When markets fall, the expected response is for money to slow down or stop. Redemptions rise, new purchases dry up, and fund managers brace for outflows. That is the textbook pattern, and for much of Indian mutual fund history, it held up reasonably well.
It is no longer the whole story. In March 2026, as the Nifty 50 and Sensex both fell over 11 percent in a single month, equity funds recorded net inflows of 40,450 crore, a 55 percent jump from the month before. Investors were not just staying put. They were putting in more money than usual during one of the sharpest monthly corrections in years. This piece looks at the actual reasons behind that behaviour, rather than simply restating that it happened.
The Numbers Behind the Question
Before getting into why, it is worth being precise about what actually happened, since the scale of the pattern is easy to understate.
| Metric | What Happened in March 2026 |
|---|---|
| Nifty 50 / Sensex | Fell 11.3% / 11.5% during the month |
| Equity fund net inflows | ₹40,450 crore, up 55% from February |
| SIP contributions | ₹32,087 crore, a record high |
| Domestic institutional equity buying | ₹1,42,960 crore, nearly 4x February |
Every one of these numbers moved in the direction you would not expect during a sharp correction. Understanding why requires looking at several separate forces that appear to be working together, rather than a single explanation.
Reason 1: SIPs Remove the Decision From the Moment of Panic
The single biggest structural reason equity inflows held up is that a large share of that money was never a discretionary decision made in the moment. A SIP is a standing instruction, set up in advance, that debits a fixed amount on a fixed date regardless of what happened in the market that week.
This matters because the emotional peak of a correction, the point at which an investor is most likely to panic and redeem, is exactly the point at which a SIP requires no action at all to continue. The investor would have to actively cancel the mandate to stop investing, which is a higher-friction decision than simply doing nothing and letting the SIP continue as scheduled. SIP contributions crossed 32,087 crore for the first time in March 2026, precisely the month the market fell hardest.
Reason 2: A Fund Base That Has Actually Lived Through a Correction Before
Investor experience appears to be compounding in a way that becomes visible only when you look beyond a single month’s data. AMFI data on SIP account age shows that the share of regular plan SIP assets held for more than five years nearly tripled between 2020 and 2025, from 12 percent to 33 percent. Direct plan assets in that same age bracket rose from 4 percent to 19 percent.
A growing share of the investor base has now lived through at least one full market cycle, entering, watching a correction, staying invested, and seeing a recovery. That lived experience appears to change behaviour the next time a correction arrives. Investors who have already seen a fall followed by a recovery are less likely to treat the next fall as a reason to exit.
Reason 3: Many Investors Treated the Dip as a Valuation Opportunity
Looking at where the fresh money actually went in March 2026 suggests a meaningful share of investors were not just tolerating the fall; they were actively buying into it.
| Category | Net Inflows in March 2026 |
|---|---|
| Flexi-cap funds | ₹10,054 crore |
| Smallcap funds | ₹6,264 crore |
| Midcap funds | ₹6,064 crore |
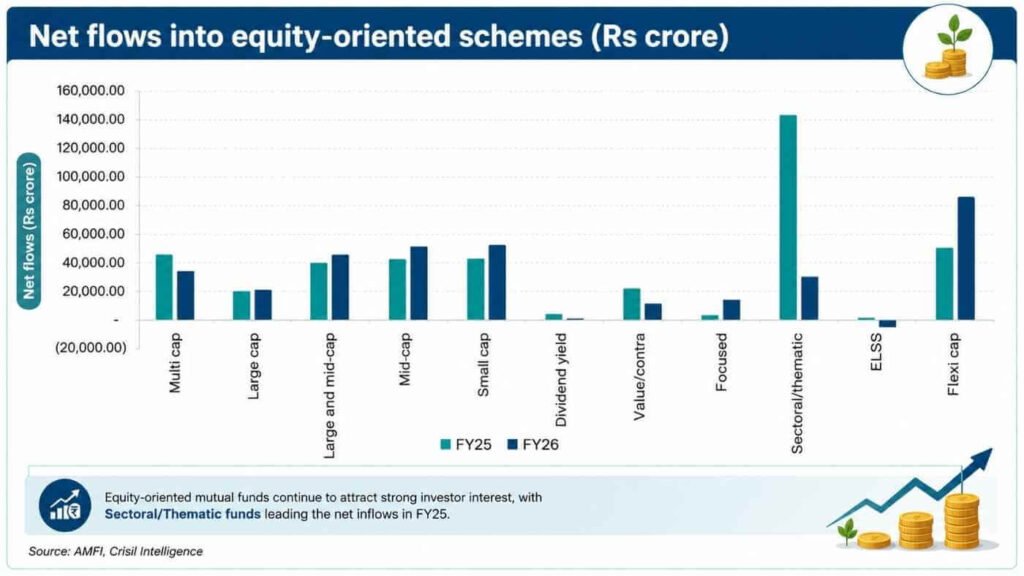
Flexi-cap funds, which give fund managers freedom to shift between large, mid, and smallcap stocks, attracted the largest share of new equity money. Smallcap and midcap funds, generally considered higher-risk, higher-potential-return categories, also saw strong inflows. This pattern looks less like passive continuation of existing habits and more like active investors treating lower valuations as an entry point into categories they see as more attractive after a correction.
Reason 4: Domestic Institutional Money Signals Confidence
Retail SIP flows were not acting alone. Domestic institutional investors, powered heavily by mutual fund buying, purchased equities worth 1,42,960 crore in March 2026, nearly four times what they bought in February, even as foreign investors were net sellers through the same period.
This creates a kind of reinforcing signal. When domestic institutions are visibly buying through a correction, it can reassure retail investors that the fall is being treated as an opportunity by professional money managers too, rather than a warning sign being ignored only by individual investors. Confidence and continued buying tend to feed each other in both directions, up and down.
Reason 5: A Structurally Younger, More Digitally Native Investor Base
India’s demat account base, closely linked to how many people can transact in mutual funds and equities easily, grew from 2.33 crore in March 2015 to 19.24 crore in March 2025, a roughly 23 percent compound annual growth rate. Much of this growth has come from investors who started participating in markets through mobile apps rather than paper forms and physical branch visits.
An investor base that entered markets digitally, often more recently and often younger, has statistically shown different behaviour patterns than an older generation that experienced fewer, more severe crises with far less digital infrastructure to manage investments through them. Easier account access appears to have coincided with steadier behaviour, not more reactive trading, based on the holding period trends already discussed.
Reason 6: Advisor and Distributor Guidance Discourages Panic Selling
A meaningful share of India’s mutual fund investors invest through a distributor or advisor rather than making every decision independently. That relationship matters most precisely during a correction, when an advisor’s role shifts from fund selection to behavioural coaching.
Advisors who actively reach out during a fall, explain what is actually driving the correction, and remind investors why they started investing in the first place appear to reduce panic-driven redemptions among their client base. This is one of the more direct, practical reasons continued investing during volatility is not purely a function of investor psychology alone. It is also a function of the guidance many investors are receiving at exactly the right moment.
Reason 7: A Track Record That Keeps Reinforcing the Behaviour
Perhaps the simplest explanation is also the most powerful one: staying invested through past corrections has, on average, worked out. A ceasefire in the West Asia conflict by mid-April 2026, combined with cheaper valuations after the correction, helped the Nifty rise 7.46 percent and the Sensex rise 6.90 percent that month, their best monthly performance in 28 months.
Every time this pattern repeats, investors who stayed invested get direct, personal evidence that staying invested was the right call, which makes them more likely to repeat that behaviour the next time markets fall. Over enough cycles, this becomes a self-reinforcing habit rather than a one-off decision.
Is This Pattern Guaranteed to Continue?
None of these reasons guarantee that Indian investors will always behave this way during every future correction. The corrections examined here, including March 2026, were relatively short and were followed by identifiable catalysts for recovery, a ceasefire, in that case. A longer, more structural downturn tied to a genuine economic slowdown rather than a geopolitical event could test investor patience very differently, and past behaviour during shorter corrections is not a reliable predictor of how the same investors would respond to a prolonged one.
It is also worth noting that account-level churn has not disappeared. The SIP stoppage ratio, the share of SIP accounts closing relative to new ones opening, has risen over the past several years and regularly crosses 100 percent in certain months. Some investors clearly are stepping away, even as the aggregate money data shows continued strength.
What This Means for You as an Investor
Understanding why other investors have stayed invested through recent volatility is useful context, but it should not be the reason you personally decide to stay invested or increase your contributions.
| If You’re Wondering Whether to Follow the Trend… | What to Consider |
|---|---|
| You’re tempted to invest more simply because others are | Make sure the decision fits your own goals and risk appetite, not just aggregate sentiment. |
| You feel reassured because DIIs are buying | Institutional buying reflects their own mandates and time horizons, which may differ from yours. |
| You’ve never been through a real correction before | This is a good time to test your risk tolerance with a financial advisor, not with your full portfolio. |
| You’re already staying invested through discipline | The data suggests this has generally worked in India’s recent history, though it is not guaranteed. |
The evidence suggests that continuing to invest through a correction has generally been rewarded in India’s recent market history, and that a combination of automation, growing experience, institutional support, and better guidance has made that behaviour more common. Whether that is the right approach for you specifically still depends on your own goals, time horizon, and risk appetite, not on what the aggregate data shows other investors doing.
This is exactly the kind of decision worth making with guidance rather than by copying the herd. A VSJ FinMart advisor can help you figure out whether staying the course, adjusting your allocation, or doing something different altogether is right for your specific situation, rather than assuming the aggregate trend applies to you by default.
Frequently Asked Questions on Equity Investing During Volatility
| Question | Answer |
|---|---|
| Why did equity mutual fund inflows rise during the March 2026 market fall? | A mix of factors: automatic SIP mandates continuing to run, investors buying into lower valuations, strong domestic institutional buying, and a growing base of investors who have already been through a market cycle before. |
| Are all investors staying invested during corrections, or just some? | Not all. The SIP stoppage ratio, the share of accounts closing versus opening, has also risen in recent years, showing account-level churn continues even as aggregate money flows stay strong. |
| Does continued equity investing during a correction guarantee good returns? | No. Past patterns, including the recovery after March 2026, are not a guarantee of future results, and a longer or more structurally driven downturn could test investor behaviour differently. |
| Is domestic institutional buying during a correction a reliable signal for retail investors? | It can be a useful confidence signal, but institutional investors have their own mandates and time horizons, which may not match an individual investor’s goals. |
| Should I invest more just because other investors are doing so during a correction? | Not automatically. Your own investment decisions should be based on your specific goals, risk appetite, and time horizon, not on what the aggregate market is doing. |
Final Words
Equity mutual fund inflows rising during a sharp correction is not an accident or a single cause. It reflects several forces working together: the automatic nature of SIPs, a growing base of investors who have already lived through a market cycle, active buying by investors treating the fall as an opportunity, confidence signals from domestic institutional money, a younger and more digitally engaged investor base, active advisor guidance, and a track record that keeps reinforcing the same behaviour each time it repeats.
None of these reasons guarantee the pattern continues in every future correction, and account-level churn shows not every investor is behaving the same way. What the data does show clearly is that the old assumption, that Indian investors panic and pull out the moment markets fall, is no longer the full picture. A conversation with a VSJ FinMart advisor is the right way to figure out where you personally fit into that picture, and what makes sense for your own money the next time markets get volatile.
Disclaimer
The information provided in this blog is for educational and informational purposes only and should not be construed as investment advice. Historical data and patterns discussed here do not guarantee future results. Please consult a qualified financial advisor before making any investment decisions. Shashikant Chanderkumar Mudaliar (ARN: 319377), operating under the brand name VSJ FinMart, is an AMFI-registered Mutual Fund Distributor (MFD) and does not provide investment advisory services. Mutual fund investments are subject to market risks. Past performance is not indicative of future results. Please read all scheme-related documents carefully before investing. Registration details can be verified at www.amfiindia.com/locate-distributor.